| Trade Statistics Dashboard |
| Tree Map
|
 Treemap representation of trade by section and chapter as a proportion of total trade. Treemap representation of trade by section and chapter as a proportion of total trade.
|
| Click on the section to drill-down into chapters and click again to drill-back up to section view. Hover over section to see specific values.
|
|
| Bubble Chart - Countries
|
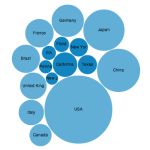 Bubble chart representation of trade by country. Bubble chart representation of trade by country.
|
| Size of circles represent countries contribution and colour of circles represent world region groups. |
|
| Bubble Chart Commodities |
|
Bubble chart representation of trade by commodities. |
| Size of circles represent chapter contribution, and colour of circles represent section groups. |
|
|
Trade Balance Trend
|
 Monthly import, export and trade balance trend over time.
 |
| Graphical depiction of the monthly import, export and trade balance figures from january 2010. |
|
|
|
|
|
Trade Balance World Map |
 Geographical representation of Trade Balance by Country. Geographical representation of Trade Balance by Country. |
| Red shows countries with a trade deficit and Green shows country with trade surplus. |
|
| FAQ - Relationships |
 Explore hierachies - commodities, World regions, trade blocks. Explore hierachies - commodities, World regions, trade blocks. |
Explore relationships between: a) 23 sections and 99 chapters, b) world regions, c) trade blocks.
|
|
|
|
|